During most of my career in data science, I’ve been used to dealing with analysis where there is an objective correct answer. This is bread and butter to data mining: you create a model and test it against reality. Your model is either good or bad (or sufficiently good!) and you can choose to use it or not.
But since joining THE I’ve been faced with another, and in some ways very different problem – building our new World University Rankings – a challenge where there isn’t an absolute right answer.
So what can you, as a data scientist, do to make sure that the answer you provide is as accurate as possible? Well it turns out (not surprisingly) that the answer is being as certain as possible about the quality, and biases in the input data.
Papers and citations
One of the key elements of our ranking is the ability of a University to generate valuable new knowledge. There are several ways we evaluate that, but one of the most important is around new papers that are generated by researchers. Our source for these is Elsevier’s Scopus database – a great place to get information on academic papers.
We are interested in a few things: the number of papers generated by a University, the number of papers with international collaboration, and the average number of citations that papers from a University get.
Citations are key. They are an indication that the work has merit. Imagine that in my seminal paper “French philosophy in the late post-war period” I chose to site Anindya Bhattacharyya’s “Sets, Categories and Topoi: approaches to ontology in Badiou’s later work“. I am telling the world that he has done a good piece of research. If we add up all the citations he has received we get an idea of the value of the work.
Unfortunately not all citations are equal. There are some areas of research where authors cite each other more highly than in others. To avoid this biasing our data in favour of Universities with large medical departments, and against those that specialise in French philosophy, we use a field weighted measure. Essentially we calculate an average number of citations for every* field of academic research, and then determine how a particular paper scores compared to that average.
These values are then rolled up to the University level so we can see how the research performed at one University compares to that of another. We do this by allocating the weighted count to the University associated with an author of a paper.
The Many Authors problem
But what about papers with multiple authors? Had Anindya been joined by Prof Jon Agar for the paper, then both learned gentlemen’s institutions would have received credit. Dr Meg Tait also joins, so we have a third institution that gains credit and so on.
Whilst the number of author remains small that works quite well. I can quite believe that Prof Agar, Dr Tait and Mr Bhattacharya all participated in the work on Badiou.
At this point we must depart from the safe world of philosophy for the dangerous world of particle physics**. Here we have mega-experiments where the academic output is also mega. For perfectly sound reasons there are papers with thousands of authors. In fact “Observation of a new particle in the search for the Standard Model Higgs boson with the ATLAS detector at the LHC” has 2932 authors.
Did they all contribute to the experiment? Possibly. In fact, probably. But if we include the data in this form in our rankings it has some very strange results. Universities are boosted hugely if a single researcher participated in the project.
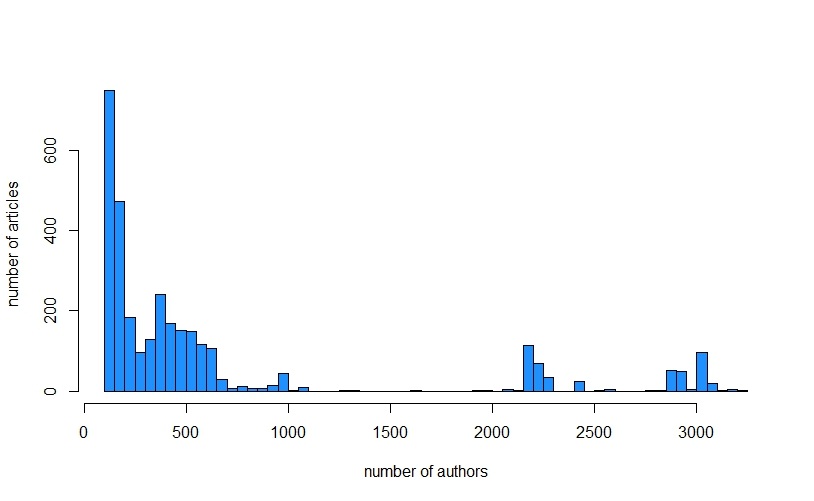
I feel a bit text bound, so here is a graph of the distribution of papers with more than 100 authors.

Frequency of papers with more than 100 authors
Please note that the vast majority of the 11 million papers in the dataset aren’t shown! In fact there are approximately 480 papers with more than 2000 authors.
Not all authors will have had the same impact on the research. It used to be assumed that there was a certain ordering to the way that authors were named, and this would allow the reduction of the count to only the significant authors. Unfortunately there is no consensus across academia about how this should happen, and no obvious way of automating the process of counting it.
Solutions
How to deal with this issue? Well for this year we’re taking a slightly crude, but effective solution. We’re simply not counting the papers with more than 1000 authors. 1000 is a somewhat arbitrary cut off point, but a visual inspection of the distribution suggests that this is a reasonable separation point between the regular distribution on the left, and the abnormal clusters on the right.
In the longer term there are one technical and one structural approach that would be viable. The technical approach is to use a fractional counting approach (2932 authors? Well you each get 0.034% of the credit). The structural approach is more of a long term solution: to persuade the academic community to adopt metadata that adequately explains the relationship of individuals to the paper that they are ‘authoring’. Unfortunately I’m not holding my breath on that one.
*well, most
**plot spoiler: the world didn’t end