Thoughts on the numbers: Uber

Uber lost it’s licence.

It is, in many ways, an unpleasant company – making itself less unpleasant only by taking on deeply unpleasant vested interests. (To be transparent: I’m mildly on Uber’s side in this – I have had fewer unpleasant journeys in Uber than in Black Cabs. The worst Uber trip I’ve had has been safe and boring, the worst Black Cab trip I’ve had has involved racist commentary… But in the spirit of data, let’s just say that n is too small to draw definite conclusions from this).

But there are a couple of arguments going around that are, at best, unhelpful.

Uber doesn’t have 40,000 drivers

A number of people (letters in the Guardian, Twitter) are saying that it is ‘widely accepted’ that Uber doesn’t have 40,000 drivers as it claims. Surely that’s a ridiculously high number?

But in 2015 there were over 120,000 taxi drivers in London – including about 27,000 Black Cab drivers. We know that Uber’s position is to dominate a market place, so it doesn’t seem unlikely that there could be 40,000. And until someone comes up with a sourced alternative, it seems bizarre to claim that the number is wrong because.

If they do have 40,000 it’s because most of them work part time…

That might be true. But it’s only relevant from a data perspective if the balance of part time Uber drivers is different than the balance for any other group of taxi drivers. And as we will see it might not have an impact on one of the other major claims.

Uber isn’t safe

There are a number of claims about this, including basic misunderstandings, such as the idea that Uber has no licence, or that it’s drivers aren’t licensed.

However, we do have a bit of data to help answer the question of sexual assault, although it is, at best, partial: the Guardian reports that the Met Police are looking into 32 complaints of rape or sexual assault associated with Uber. Now to be clear, no sexual assault is acceptable.

But the claim is that Uber is dangerous and other taxis are safe. And that claim doesn’t seem to be supported by the data. Because the Guardian also reports that the total number of complaints that are associated with taxi drivers is 154.

So Uber are responsible for 20% of complaints, whilst having 33% of drivers.

These numbers are (of course) open to be challenged if better data becomes available.

It could be that if the claim that many Uber drivers are only part time is true, that a better measure, such as modifying this value by the number of journeys might be more relevant.  And it is quite likely that this data will come out in court. But it seems capricious to deny numbers that do exist in favour of numbers that don’t (yet).

Where is the data?

Of course one of the obvious conclusions is that TfL should do a far far better job of publishing data that is important to the public in London.

Algorithmic accountability, NYC edition

512px-NYC_wideangle_south_from_Top_of_the_Rock

New York by Daniel Schwen (Own work) [CC BY-SA 2.5], via Wikimedia Commons

There is an interesting attempt to create algorithmic accountability in New York.  It seems that they will attempt to pass this into law:

Accountability2

If this was applied in the private sector it would probably fail horribly. But in the public sector, what are its strengths and limitations?

Strengths

As I’m going to spend a lot of time looking at difficulties, it’s only fair to start with positives:

  • It’s simple – it doesn’t attempt to be unnecessarily complex
  • It introduces the idea that people can look at impacts, rather than just code

The second of these looks like an interesting way forward. I might suggest an alternative, which would be a ability to evaluate the overall impact of full result sets – thus enabling you to investigate biases in the round, rather than focusing on individual results, some of which will always be wrong!

Definition of an algorithm and data

This is probably the first challenge. When is something an algorithm? When does it use data? If I have a set of actions that I always take in a certain order (for example, I open the city’s parks in a specific order) is that an algorithm? Even that simple example impacts people, as park A is open 5 minutes before park B…

And what is data? Does it have to be in a computer? How about if it’s written down?

Generally I’m in favour of opening decisions to scrutiny, but I firmly believe it should be all decisions, not just computer decisions!

What is source code?

A naive reading of this would suggest that source code could be as simple as pointing at the R code behind an approach. Or it could mean publishing the actual model.

The first is easy to do, the second isn’t. Trained models aren’t necessarily designed to be published in an interpretable way (a bit like the difference between compiled and uncompiled code) – so should we limit approaches to ones where a ‘raw’ or interpretable model could be generated? Even if we could, it might not mean much without the software used to run it. In essence it might be worse than useless.

Another challenge is where does a model begin? A lot of time is spent preparing data for a model. Up to 80% of the time when generating a model. If you just show the model, without describing all of the steps that are needed to transform the data, then you are going to severely mislead.

Data submission

But what about allowing users to submit data and see the impact? This is an interesting idea. But it too has some interesting consequences.

What would you do if someone actively used this to game the system? Because they will. Yes, you could monitor use, but then you end up in another area of potential moral difficulty. And it’s one thing if someone is using it to understand how to maximise the benefits they receive (actually I kind of approve of this), but what if they are using it to understand how to avoid predictive policing? And can the police use this data to change their predictive policing approach?

Another interesting problem is that often a single result doesn’t tell you much. Yes I can see that my zip code has a predictive policing score of 10. But unless I know the predictive scores of all other zip codes, plus a huge range of other things, that doesn’t tell me much.

And how do you stop people from using it to spy on their neighbours? Entering in other people’s data to find out things about them?

Unintended consequences

Finally, some thoughts about unintended consequences. Will this discourage effectiveness and efficiency? After all, if I use a dumb human to make a bad decision, then I won’t be held accountable in the same way as if I use a smart algorithm to make a good decision. And this is important because there will always be mistakes.

Will there be any attempt to compare the effectiveness against other approaches, or will there be an assumption that you have to beat perfect scores in order to avoid legal consequences?

Will vendors still be willing (or even able) to sell to NYC on this basis?

Final thoughts

I think this is an interesting approach, and certainly I’m not as negative about it as I was originally (sorry, shouldn’t tweet straight off a plane!). Thanks to@s010n and@ellgood for pointing me in this direction…

THE Ranking Cycle

Unusually, for me, this blog concerns my (paid) work! A large part of that is putting together the various rankings for Times Higher Education. Now, from the inside these all make perfect sense, and we’re well aware of when they happen. But from the outside, maybe less so.

This blog is really designed for people interested either in submitting data, or for using the outcomes of our rankings. And possibly a few rankings geeks too. But mainly it is designed as a handy reference point. As dates get closer I will update this blog to reflect the progress of the cycle.

As a brief reminder, THE produces two levels of ranking: Rankings (note the capitals) and editorial analysis. Our main focus from a data team is on the former, although we do support our friends in the magazine on editorial analysis too.

The Rankings are far more structured, and also more likely to be tied down in terms of dates. Publication dates are usually designed to coincide with one of our Summit series.

Within the Rankings there are two streams: the World University Ranking, and our Teaching Rankings – currently the Japan University Ranking, and the US College Ranking.

The approximate dates for our next rankings are as given below:

World University Ranking Series

Name Date Data collection cycle
Reputation 15/06/2017 2017
Europe 22/06/2017 2016
SE Asia 05/07/2017 2016
Latam 20/07/2017 2017
WUR 05/09/2017 2017
Subjects September 2017 2017
BRICS and Emerging December 2018 2017
Asia February 2018 2017
Young Spring 2018 2017
Reputation Summer 2018 2018
SE Asia Summer 2018 2017


Teaching Series

Name Date Data collection cycle
US College 28/09/2017 2017
Japan University Spring 2018 2017
European Teaching Summer 2018 2017


Editorial Analysis

This is (inevitably) more variable, as it depends on what the editorial team think is insightful and interesting to our readership, but it is likely to include the following:

Name Date Data collection cycle Data source
Employer November 2017 2017 Survey
Liberal Arts Winter 2017/18 2017 USA
International Winter 2017/18 2017 WUR
UK Student Spring 2018 2017 Survey
Small Universities Spring 2018 2017 WUR

How in love with AI are you?

AI is a problematic term at the moment. There is an awful lot of conflation between true existential/ubiquitous computing/end of the world AI on the one hand, and a nerd in a basement programming a decision tree in R on the other.

Which makes for some nice headlines. But isn’t really helpful to people who are trying to work out how to make the most (and best) of the new world of data opportunities.

So to help me, at least, I have devised something I call the LaundryCulture Continuum. It helps me to understand how comfortable you are with data and analytics.

(Because I realise that the hashtag #LaundryCulture might confuse, I’ve also coined the alternative #StrossMBanks Spectrum).

So here are the ends of the Continuum, and a great opportunity to promote two of my favourite writers.

In the beautiful, elegant and restrained corner, sits The Culture. Truly super-intelligent AI minds look on benevolently at us lesser mortals, in a post-scarcity economy. This is the corner of the AI zealots.

PlayerofGames

In the squamish corner sits The Laundry, protecting us from eldricht horrors that can be summoned by any incompetent with a maths degree and a laptop. This is the home of the AI haters.

AttrocityArchives

Where do people sit? Well it’s pretty clear that Elon Musk sits towards The Culture end of the Continuum. Naming his SpaceX landing barges Just Read The Instructions and Of Course I Still Love You is a pretty big clue.

The Guardian/Observer nexus is hovering nearer The Laundry, judging by most of its recent output.

Others are more difficult… But if I’m talking to you about AI, or even humble data mining, I would like to know where you stand…

In defence of algorithms

I was going to write a blog about how algorithms* can be fair. But if 2016 was the year in which politics went crazy and decided that foreigners were the source of all problems, it looks like 2017 has already decided that the real problem is that foreigners are being assisted by evil algorithms.

So let’s be clear. In the current climate people who believe that data can make the world a better place need to stand up and say so. We can’t let misinformation and ludditism wreck the opportunities for the world going forwards.

And there is a world of misinformation!

For example, there is currently a huge amount of noise about algorithmic fairness (Nesta here , The Guardian here et al). I’ve already blogged a number of times about this (1, 2, 3), but decided (given the noise) that it was time to gather my thoughts together.

prime_directives

(Most of) Robocop’s prime directives (Image from Robocop 1987)

tldr: Don’t believe the hype, and don’t rule out things that are fairer than what happens at the moment.

Three key concepts

So here are some concepts that I would suggest we bear in mind:

  1. The real world is mainly made up of non-algorithmic decisions, and we know that these are frequently racist, sexist, and generally unfair.
  2. Intersectionality is rife, and in data terms this means multicolinearity. All over the place.
  3. No one has a particularly good definition of what fairness might look like. Even lawyers (although there are a number of laws about disproportionate impact even then it gets tricky).

On the other side, what are the campaigners for algorithmic fairness demanding? And what are their claims?

Claim 1: if you feed an algorithm racist data it will become racist.

At the most simple level yes. But (unlike in at least one claim) it takes more than a single racist image for this to happen. In fact I would suggest that generally speaking machine learning is not good at spotting weak cases: this is the challenge of the ‘black swan’. If you present a single racist example then ML will almost certainly ignore it. In fact, if racism is in the minority in your examples, then it will probably be downplayed further by the algorithm: the algorithm will be less racist than reality.

If there are more racist cases than non-racist cases then either you have made a terrible data selection decision (possible), or the real problem is with society, not with the algorithm. Focus on fixing society first.

Claim 2: algorithmic unfairness is worse/more prevalent than human unfairness

Algorithmic unfairness is a first world problem. It’s even smaller scale than that. It’s primarily a minority concern even in the first world. Yes, there are examples in the courts in the USA, and in policing. But if you think that the problems of algorithms are the most challenging ones that face the poor and BAME in the judicial system then you haven’t been paying attention.

Claim 3: to solve the problem people should disclose the algorithm that is used

Um, this gets technical. Firstly, what do you mean by the algorithm? I can easily show you the code used to build a model. It’s probably taken from CRAN or Github anyway. But the actual model? Well if I’ve used a sophisticated technique, a neural network or random forrest etc, it’s probably not going to be sensibly interpretable.

So what do you mean? Share the data? For people data you are going to run headlong into data protection issues. For other data you are going to hit the fact that it will probably be a trade secret.

So why not just do what we do with human decisions? We examine the actual effect. At this point learned judges (and juries, but bear in mind Bayes) can determine if the outcome was illegal.

And in terms of creation? Can we stop bad algorithms from being created? Probably not. But we can do what we do with humans: make sure that the people teaching them are qualified and understand how to make sensible decisions. That’s where people like the Royal Statistical Society can come in…

Final thoughts

People will say “you’re ignoring real world examples of racism/sexism in algorithms”. Yes, I am. Plenty of people are commenting on those, and yes, they need fixing. But very very rarely do people compare the algorithm with the pre-existing approach. That is terrible practice. Don’t give human bias a free pass.

And most of those examples have been because of (frankly) beginners mistakes. Or misuse. None of which are especially unique to the world of ML.

So let’s stand up for algorithms, but at the same time remember that we need to do our best to make them fair when we deploy them, so that they can go on beating humans.


* no, I really can’t be bothered to get into an argument about what is, and what is not an algorithm. Let’s just accept this as shorthand for anything like predictive analytics, stats, AI etc…


A brief* analysis** of Labour’s NEC Candidates

LabourosewwwbgrOne of the frustrations of the Labour NEC elections is that you never really know who you’re voting for. Well, obviously you known their names, and they’re happy to give you an impressive list of the Committees they have been elected to (and they are always Committees, not committees).

But what is their stance? Who do they support? Are they Traitorous Blairite Scum™ or Vile Entryist Trots®? How do we know? No one actually says: “I’m backing Eagle. She’s great” or “Corbyn for the Win!”. So we’re left guessing, or poring through their candidate statements, or worse still, relying on the various lobby groups to give us a clue to the slates etc.

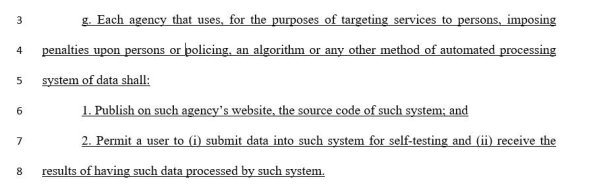
So, instead of that, because, frankly, it’s boring, I decide to do a little bit of word frequency analysis, to see if there were words that were unique, or at least more likely to come up in one group or another.

To help me categorise the candidates, I followed a helpful guide from Totnes Labour Party. That gave me the two major slates: Progress/Labour First*** vs the something something Grassroots Alliance***.

So, all I need to do is go to the Labour Party site, download the candidate statements, and away I go. Except, of course, the Party website is bloody useless at giving actual information.

So once more it’s back to the Totnes Labour website, supported by Google. I can’t find statements from every candidate, but I get most of them. Enough for this, anyway.

Normally I would fire up R, load the data, and away I go. But actually there is so little of it that it’s time for some simple Excel kludging.

Methodology*****

First I put all the text from each slate into a single document. Remove case sensitivity, and work out the frequency of each word (with common stop words, natch).

I know that this means I can’t play with tf-idf (sorry, Chris), but really there weren’t enough documents to call this a corpus anyway.

Now I create a common list of words, with the frequency in each slate. This isn’t as easy as it sounds, because a straightforward stemming approach isn’t really going to cut it. These documents are in SocialistSpeak (Centre-left social democratic/democratic socialist sub variant), and so need handcrafting. There is, for example, a world of difference between inclusive and inclusion.

So once that tedious task is out of the way, I took the frequency with which each word appeared in each slate, and simply subtracted one from the other.

Results

Firstly, which are the most frequently used words across both slates?

Word Avg Freq
MEMBER 2.7%
LABOUR 2.5%
PARTY 2.3%
NEC 1.5%
WORK 1.1%
NEED 1.1%
ELECTION 1.1%
POLICY 0.9%
SUPPORT 0.9%
YEARS 0.9%
WIN 0.8%
CLP 0.8%
CAMPAIGN 0.8%
PEOPLE 0.7%
WILL 0.7%
GOVERNMENT 0.7%
POLITICS 0.7%
WALES 0.6%
NATIONAL 0.6%
JEREMY 0.6%

These words appear frequently in both camps. You can easily imagine statements containing them:

“Since I was elected to the NEC in 2010 I have spent six years supporting members of the Labour Party. Sadly Jeremy can’t win in Wales/Only Jeremy can win an election against this Government”

I don’t really know why Wales pops up.

But let’s look at each slate independently.

Team M

Firstly, Team Momentum****** (or the Centre-Left Grassroots Alliance (It isn’t clear where the apostrophe should go (or indeed, if there should be one))).

logo300

These are the words most likely to be in a Momentum candidate’s statement and not in a Progress candidate’s statement, in order of momentum (sorry, couldn’t resist):

WALES 1.2%
JEREMY 0.9%
YEARS 1.2%
PUBLIC 0.9%
COMMITMENT 0.6%
LONDON 0.8%
SERVICES 0.7%
NATIONAL 0.9%
CLP 1.1%
LABOUR 2.7%
ELECTION 1.3%
EQUALITY 0.5%
JOBS 0.5%
COMMITTEE 0.6%
SECRETARY 0.4%
WORK 1.3%
CLEAR 0.4%
BELIEVE 0.6%
UNION 0.7%
GIVE 0.4%

I think we’ve found where Wales comes from: a proud Welsh candidate on the Momentum slate.

They are proud of Jeremy, are probably active in their union, have been a party secretary.

Team P/L1

How about Team Progress? (Or the less impressively websited Labour First)

progress

NEED 1.7%
MEMBER 3.3%
PEOPLE 1.1%
WILL 1.1%
NEC 1.8%
WIN 1.2%
PARTY 2.6%
COUNTRY 0.6%
THINK 0.6%
FIGHT 0.7%
PUT 0.7%
LOCAL 0.8%
LISTEN 0.5%
VOTE 0.4%
NEW 0.7%
DECISIONS 0.3%
ENGAGE 0.3%
MEAN 0.3%
WELCOME 0.3%
POLITICS 0.8%

Woah! That looks very different. Without wanting to judge either group’s politics, one looks (at first) like a very technocratic list of achievements, and the other a very wide forward looking approach. This may simply be reflecting the fact that the Leader of the Party is on the Momentum side, so they have more things to look at and say “this is our record” where as the opposition have to look to a future.

Team WTF?

Are there any oddities?

Well, Blair and Brown (and Iraq) are mentioned by Progress, and not by Momentum, which is perhaps strange. Afghanistan is mentioned by Momentum.

Britain, England, and Scotland are mentioned far more by Momentum (as is Wales, but let’s ignore that for now).

Everyone is claiming to be a socialist. But not very much. (There was one use of socialist on each side. Of course maybe everyone assumes that everyone else knows they are a socialist).

Privatisation is mentioned by Momentum, renationalisation by Progress.

The word used most by Momentum but not at all by Progress is commitment.

The words used most by Progress and not at all by Momentum are country and think (it’s a tie).

But surely…?

What should I really have done to make this a proper analysis?

  • Firstly I should have got all the data.
  • Then I should probably have thought about some more systematic stemming, and looking at n-grams (there is a huge difference between Labour and New Labour).

There are a whole range of interesting things you can do with text analysis, or there are word clouds.

 Footnotes

*Very brief

**Only just, but more later!

***And this is why there is a problem. No one wants to call themselves: No Progress at All, or Labour Last, and everyone thinks that they represent the grassroots. I’ve yet to see a group that markets itself as the home of the elitist intellectuals****

****Well maybe the Fabians. But I didn’t say it.

*****This seems to over dignify it. But heck.

******They deny this.


DataScience post Brexit

EU_Flag_specification

This is not an analysis of how people voted, or why. If you’re interested then look at some of John Burn-Murdoch’s analysis in the FT, or Lord Ashcroft’s polling on reasons.

It is, however, an attempt to start to think about some of the implications for DataScience and data scientists in the new world.

Of course, we don’t really know what the new world will be, but here we go:

Big companies

The big employers are still going to need data science and data scientists. Where they are pretty much stuck (telcos, for example) then data science will continue. If there is a recession then it may impact investment, but it’s just as likely to encourage more data science.

Of course it’s a bit different for multi-nationals. Especially for banks (investment, not retail). These are companies with a lot of money, and big investments in data science. Initial suggestions are that London may lose certain financial rights that come with being in the EU, and that 30-70,000 jobs may move.

Some of these will, undoubtably, be data science roles.

Startups

But what about startups? There are a few obvious things: regulation, access to markets, and investment.

We may find that the UK becomes a less country with less red-tape.  I somehow doubt it. But even if we do, in order to trade with Europe we will need to comply (more of that later).

Access to markets is another factor. And it is one that suggests that startups might locate, or relocate, in the EU.

Investment is also key. Will VCs be willing to risk their money in the UK? There is some initial evidence that they are less keen on doing so. News that some deals have been postponed or cancelled. Time will tell.

In many ways startups are the businesses most able to move. But the one thing that might, just might keep them in the UK is the availability of data scientists. After the US the UK is probably the next most developed market for data scientists.

Data regulation

At the moment the UK complies with EU data provisions using the creaking Data Protection Act 1998. That was due to be replaced by the new data directive. But from the UK’s perspective that may no longer happen.

That brings different challenges. Firstly the UK was a key part of the team arguing for looser regulation, so it’s likely that the final data directive may be stronger than it would otherwise have been.

Secondly, the data directive may simply not apply. But in that case what happens to movement of data from the EU to the UK? Safe Harbor, the regime that allowed EU companies to send data to the US, has been successfully challenged in the courts, so it is unlikely that a similar approach would fly.

What then? Would we try to ignore the data directive? Would we create our own, uniquely English data environment? Would we hope that the DPA would still be usable 20, 30 or 40 years after it was written?

People

Data scientists, at the moment, are rare. When (or if) jobs move, then data scientists will be free to move with them. They will almost always be able to demonstrate that they have the qualities wanted by other countries.

And many of our great UK data scientists are actually great EU data scientists. Will they want to stay? They were drawn here by our vibrant data science community… but if that starts to wither?


Fair data – fair algorithm?

In my third post about the ethics of data science I’m heading into more challenging waters: fairness.

I was pointed to the work of Sorelle Friedler (thank you @natematias, @otfrom, and @mia_out) on trying to remove unfairness in algorithms by addressing the data that goes into them rather than trying to understand the algorithm itself.

I think this approach has some really positive attributes:

  • It understands the importance of the data
  • It recognises that the real world is biased
  • It deals with the challenges of complex algorithms that may not be as amenable to interpretation as the linear model in my previous example.

Broadly speaking – if I’ve understood the approach correctly – the idea is this…

Rather that trying to interpret an algorithm, let’s see if the input data could be encoding for bias. In an ideal world I would remove the variables gender and ethnicity (for example) and build my model without them.

However, as we know, in the real world there are lots of variables that are very effective proxies for these variables. For example, height would be a pretty good start if I was trying to predict gender…

And so that is exactly what they do! They use the independent variables in the model to see if you can classify the gender (or sexuality, or whatever) of the record.

If you can classify the gender then the more challenging part of the work begins: correcting the data set.

This involves ‘repairing’ the data, but in a way that preserves the ranking of the variable… and the challenge is to do this in a way that minimises the loss of information.

It’s really interesting, and well worth a read.

Some potential difficulties

Whilst I think it’s a good approach, and may be useful in some cases, I think that there are some challenges that this approach needs to address, both at a technical, and at a broader level.  Firstly though let’s deal with a couple of obvious ones:

  • This approach is focused around a US legal definition of disparate impact. That has implications on the approach taken
  • The concept of disparate impact is itself a contentious ethical position, with arguments for and against it
  • Because the approach is based on a legal situation, it doesn’t necessarily deal with wider ethical issues.

Technical challenges

As always, the joy of technical challenges are that you can find technical solutions. So here we go:

  • The focus of the work has been on classifiers – where there is a binary outcome. But in reality we’re entering the world of probability, where decisions aren’t clear cut. This is particularly important when considering how to measure the bias. Where do you put the cutoff?
  • Non-linear and other complex models also tend to work differentially well in different parts of the problem space. If you’re using non-linear models to determine if data is biased then you may have a model that passes because the average discrimination is fair (i.e below your threshold) but where there are still pockets of discrimination.
  • The effect of sampling is important, not least because some discrimination happens to groups who are very much in the minority. We need to think carefully about how to cope with groups that are (in data terms) significantly under-represented.
  • What happens if you haven’t recorded the protected characteristic in the first place? Maybe because you can’t (iPhone data generally won’t have this, for example), or maybe because you didn’t want to be accused of the bias that you’re now trying to remove.  There is also the need to be aware of the biases with which this data itself is recorded…

The real difficulties

But smart people can think through approaches to those.  What about the bigger challenges?

Worse outputs have an ethical dimension too:

If you use this approach you get worse outputs. Your model will be less accurate. I would argue that when considering this approach you also need to consider the ethical impact of a less predictive model. For example, if you were assessing credit worthiness then you may end up offering loans to people who are not going to be able to repay them (which adversely effects them as well as the bank!), and not offering loans to people who need them (because your pool of money to lend is limited). This is partially covered in the idea of the ‘business necessary defence’ in US law, but when you start dealing with probabilities it becomes much more challenging. The authors do have the idea of partially adjusting the input data, so that you limit the impact of correcting the data, but I’m not sure I’m happy with this – it smacks a bit of being a little bit pregnant.

Multiple protected categories create greater problems:

Who decides what protected categories are relevant? And how do you deal with all of them?

The wrong algorithm?

Just because one algorithm can classify gender from the data doesn’t mean that a different one will predict using gender. We could be discarding excellent and discrimination free models because we fear it might discriminate, rather than because it does.  This is particularly important as often the model will be used to support current decision making, which may be more biased than the model that we want to use… We run the risk of entrenching existing discrimination because we’re worried about something that may not be discriminatory at all (or at least less discriminatory).

Conclusions

If it sounds like I think this approach is a bad one, let’s be clear, I don’t. I think it’s an imaginative and exciting addition to the discussion.

I like its focus on the data, rather than the algorithm.

But, I think that it shouldn’t be taken in isolation – which goes back to my main thesis (oh, that sounds grand) that ethical decisions need to be taken at all points in the analysis process, not just one.


Sexist algorithms

Can an algorithm* be sexist? Or racist? In my last post I said no, and ended up in a debate about it. Partly that was about semantics, what parts of the process we call an algorithm, where personal ethical responsibility lies, and so on.

Rather than heading down that rabbit hole, I thought it would be interesting to go further into the ethics of algorithmic use…  Please remember – I’m not a philosopher, and I’m offering this for discussion. But having said that, let’s go!

The model

To explore the idea, let’s do a thought experiment based on a parsimonious linear model from the O’Reilly Data Science Salary Survey (and you should really read that anyway!)

So, here it is:

70577 intercept
 +1467 age (per year above 18; e.g., 28 is +14,670)
 –8026 gender=Female
 +6536 industry=Software (incl. security, cloud services)
–15196 industry=Education
 -3468 company size: <500
  +401 company size: 2500+
–15196 industry=Education
+32003 upper management (director, VP, CxO)
 +7427 PhD
+15608 California
+12089 Northeast US
  –924 Canada
–20989 Latin America
–23292 Europe (except UK/I)
–25517 Asia

The model was built from data supplied by data scientists across the world, and is in USD.  As the authors state:

“We created a basic, parsimonious linear model using the lasso with R2 of 0.382.  Most features were excluded from the model as insignificant”

Let’s explore potential uses for the model, and see if, in each case, the algorithm behaves in a sexist way.  Note: it’s the same model! And the same data.

Use case 1: How are data scientists paid?

In this case we’re really interested in what the model is telling us about society (or rather the portion of society that incorporates data scientists).

This tells us a number of interesting things: older people get paid more, California is a great place, and women get paid less.

–8026 gender=Female

This isn’t good.

Back to the authors:

“Just as in the 2014 survey results, the model points to a huge discrepancy of earnings by gender, with women earning $8,026 less than men in the same locations at the same types of companies. Its magnitude is lower than last year’s coefficient of $13,000, although this may be attributed to the differences in the models (the lasso has a dampening effect on variables to prevent over-fitting), so it is hard to say whether this is any real improvement.”

The model has discovered something (or, more probably, confirmed something we had a strong suspicion about).  It has noticed, and represented, a bias in the data.

Use case 2: How much should I expect to be paid?

This use case seems fairly benign.  I take the model, and add my data. Or that of someone else (or data that I wish I had!).

I can imagine that if I moved to California I might be able to command an additional $15000. Which would be nice.

Use case 3: How much should I pay someone?

On the other hand, this use case doesn’t seem so good. I’m using the model to reinforce the bad practice it has uncovered.  In some legal systems this might actually be illegal, as if I take the advice of the model I will be discriminating against women (I’m not a lawyer, but don’t take legal advice on this: just don’t do it).

Even if you aren’t aware of the formula, if you rely on this model to support your decisions, then you are in the same ethical position, which raises an interesting challenge in terms of ethics. The defence “I was just following the algorithm” is probably about as convincing as “I was just following orders”.  You have a duty to investigate.

But imagine the model was a random forest. Or a deep neural network. How could a layperson be expected to understand what was happening deep within the code? Or for that matter, how could an expert know?

The solution, of course, is to think carefully about the model, adjust the data inputs (let’s take gender out), and measure the output against test data. That last one is really important, because in the real world there are lots of proxies…

Use case 4: What salary level would a candidate accept?

And now we’re into really murky water. Imagine I’m a consultant, and I’m employed to advise an HR department. They’ve decided to make someone an offer of $X and they ask me “do you think they will accept it?”.

I could ignore the data I have available: that gender has an impact on salaries in the marketplace. But should I? My Marxist landlord (don’t ask) says: no – it would be perfectly reasonable to ignore the gender aspect, and say “You are offering above/below the typical salary”**. I think it’s more nuanced – I have a clash between professional ethics and societal ethics…

There are, of course, algorithmic ethics to be considered. We’re significantly repurposing the model. It was never built to do this (and, in fact, if you were going to build a model to do this kind of thing it might be very, very different).

Conclusions

It’s interesting to think that the same model can effectively be used in ways that are ethically very, very different. In all cases the model is discovering/uncovering something in the data, and – it could be argued – is embedding that fact. But the impact depends on how it is used, and that suggests to me that claiming the algorithm is sexist is (perhaps) a useful shorthand in some circumstances, but very misleading in others.

And in case we think that this sort of thing is going to go away, it’s worth reading about how police forces are using algorithms to predict misconduct


*Actually to be more correct I mean a trained model…

** His views are personal, and not necessarily a representation of Marxist thought in general.


The ethics of data science (some initial thoughts)

Last night I was lucky enough to attend a dinner hosted by TechUK and the Royal Statistical Society to discuss the ethics of big data. As I’m really not a fan of the term I’ll pretend it was about the ethics of data science.

Needless to say there was a lot of discussion around privacy, the DPA and European Data Directives (although the general feeling was against a legalistic approach), and the very real need for the UK to do something so that we don’t end up having an approach imposed from outside.

People first

Immanuel_Kant_(painted_portrait)

Kant: not actually a data scientist, but something to say on ethics

Both Paul Maltby and I were really interested in the idea of a code of conduct for people working in data – a bottom-up approach that could inculcate a data-for-good culture. This is possibly the best time to do this – there are still relatively few people working in data science, and if we can get these people now…

With that in mind, I thought it would be useful to remind myself of the data-for-good pledge that I put together, and (unsuccessfully) launched:

  • I will be Aware of the outcome and impact of my analysis
  • I won’t be Arrogant – and I will avoid hubris: I won’t assume I should, just because I can
  • I will be an Agent for change: use my analytical powers for positive good
  • I will be Awesome: I will reach out to those who need me, and take their cause further than they could imagine

OK, way too much alliteration. But (other than the somewhat West Coast Awesomeness) basically a good start. 

The key thing here is that, as a data scientist, I can’t pretend that it’s just data. What I do has consequences.

Ethics in process

But another way of thinking about it is to consider the actual processes of data science – here adapted loosely from the CRISP-DM methodology.  If we think of things this way, then we can consider ethical issues around each part of the process:

  • Data collection and processing
  • Analysis and algorithms
  • Using and communicating the outputs
  • Measuring the results

Data collection and processing

What are the ethical issues here?  Well ensuring that you collect with permission, or in a way that is transparent, repurposing data (especially important for data exhaust), thinking carefully about biases that may exist, and planning and thinking about end use.

Analysis and algorithms

I’ll be honest – I don’t believe that data science algorithms are racist or sexist. For a couple of reasons: firstly those require free-will (something that a random forest clearly doesn’t have), secondly that would require the algorithm to be able to distinguish between a set of numbers that encoded for (say) gender and another that coded for (say) days of the week. Now the input can contain data that is biased, and the target can be based on behaviours that are themselves racist, but that is a data issue, not an algorithm issue, and rightly belongs in another section.

But the choice of algorithm is important. As is the approach you take to analysis. And (as you can see from the pledge) an awareness that this represents people and that the outcome can have impact… although that leads neatly on to…

Using and communicating the outputs

Once you have your model and your scores, how do you communicate its strengths, and more importantly its weaknesses. How do you make sure that it is being used correctly and ethically? I would urge people to compare things against current processes rather than theoretical ideals.  For example, the output may have a gender bias, but (assuming I can’t actually remove it) is it less sexist than the current system? If so, it’s a step forwards…

I only touched on communication, but really this is a key, key aspect. Let’s assume that most people aren’t really aware of the nature of probability. How can we educate people about the risks and the assumptions in a probabilistic model? How can we make sure that the people who take decisions based on that model (and they probably won’t be data scientists) are aware of the implications?  What if they’re building it into an automated system? Well in that case we need to think about the ethics of:

Measuring the results

And the first question would be, is it ethical to use a model where you don’t effectively measure the results? With controls?

This is surely somewhere where we can learn from both medicine (controls and placebos) and econometrists (natural experiments). But both require us to think through the implications of action and inaction.

Using Data for Evil IV: The Journey Home

If you’re interested in talking through ethics more (and perhaps from a different perspective) then all of this will be a useful background for the presentation that Fran Bennett and I will be giving at Strata in London in early June.  And to whet your appetite, here is the hell-cycle of evil data adoption from last year…

HellCycle